Understanding the Basics of Excel

Excel is a powerful tool that is widely used in various industries for data management, analysis, and presentation. Whether you are a student, a professional, or simply someone looking to organize your personal finances, Excel can help you achieve your goals efficiently. In this article, we will delve into the different aspects of Excel, providing you with a comprehensive guide to help you master this versatile software.
Excel Interface and Navigation

When you first open Excel, you will be greeted with a user-friendly interface. The ribbon at the top of the screen contains various tabs, such as Home, Insert, Page Layout, Formulas, Data, Review, View, and Developer. Each tab has a collection of buttons and tools that allow you to perform different tasks within Excel.
| Tab | Description |
|---|---|
| Home | Basic formatting, editing, and cell manipulation tools |
| Insert | Inserting new sheets, rows, columns, and other objects |
| Page Layout | Page setup, print options, and sheet arrangement |
| Formulas | Creating and editing formulas, functions, and named ranges |
| Data | Data validation, sorting, filtering, and data analysis tools |
| Review | Comments, track changes, and protection features |
| View | Zoom, gridlines, and other display options |
| Developer | Access to advanced features, such as VBA programming and custom forms |
Working with Cells and Ranges

Cells are the building blocks of an Excel worksheet. Each cell is identified by a unique address, consisting of a column letter and a row number. You can select individual cells, ranges of cells, or even entire columns or rows by clicking and dragging your mouse.
One of the most useful features of Excel is the ability to manipulate ranges. You can easily copy, move, and delete cells, as well as perform calculations on entire ranges. To select a range, click on the first cell, hold down the Shift key, and click on the last cell in the range.
Formulas and Functions
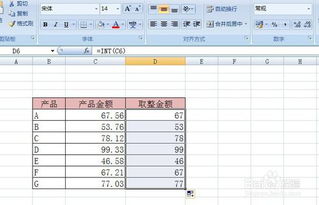
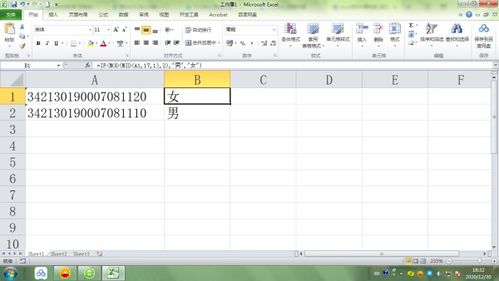
Excel’s formula and function capabilities are what set it apart from other spreadsheet software. Formulas are equations that perform calculations on values in your worksheet, while functions are predefined formulas that can be used to perform specific tasks.
Some common Excel functions include SUM, AVERAGE, MIN, MAX, and COUNT. You can enter a formula by starting with an equal sign (=) and then typing the function name followed by the arguments. For example, to calculate the sum of a range of cells, you would enter =SUM(A1:A10).
Charts and Graphs
Excel provides a wide range of chart types to help you visualize your data. You can create line charts, bar charts, pie charts, scatter plots, and more. To create a chart, select the data you want to include, go to the Insert tab, and choose the chart type you want to use.
Once you have created a chart, you can customize it by adding titles, labels, and formatting options. You can also use data labels, trendlines, and other features to make your chart more informative and visually appealing.
Conditional Formatting
Conditional formatting allows you to highlight cells based on specific criteria. For example, you can use conditional formatting to highlight cells that contain values above a certain threshold or to identify duplicates in a list.
To apply conditional formatting, select the cells you want to format, go to the Home tab, and click on the Conditional Formatting button. You can then choose from various rules, such as greater than, less than, equal to, or between, and specify the formatting options you want to apply.
Excel Templates
Excel comes with a variety of templates that you can use to create professional-looking documents, such as budgets, calendars, and invoices. To


